

Matplotlib subplot
Bir nechta chizmalarni ko‘rsatish
subplot() funksiyasi yordamida siz bitta rasmda bir nechta chizmalarni chizishingiz mumkin:
Misol
Draw 2 plots:
import matplotlib.pyplot as plt
import numpy as np
#plot 1:
x = np.array([0, 1, 2, 3])
y = np.array([3, 8, 1, 10])
plt.subplot(1, 2, 1)
plt.plot(x,y)
#plot 2:
x = np.array([0, 1, 2, 3])
y = np.array([10, 20, 30, 40])
plt.subplot(1, 2, 2)
plt.plot(x,y)
plt.show()
Natija:
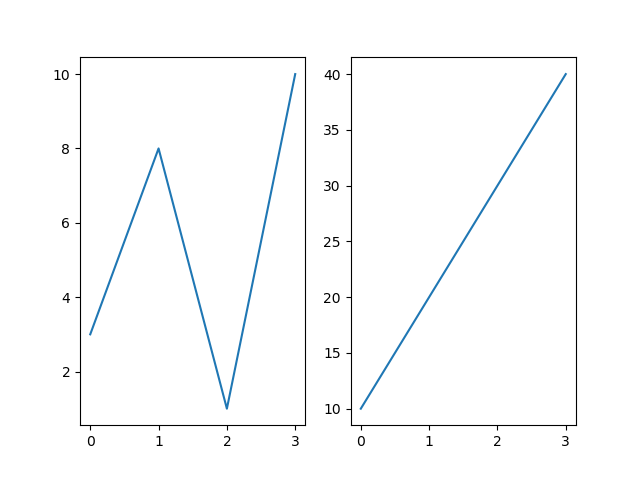
Subplot() funksiyasi
subplot() funksiyasi rasmning joylashishini tavsiflovchi uchta argumentni oladi.
Tartib birinchi va ikkinchi argumentlar bilan ifodalangan qatorlar va ustunlar shaklida tashkil etilgan.
Uchinchi argument joriy uchastkaning indeksini ifodalaydi.
plt.subplot(1, 2, 1)
#the figure has 1 row, 2 columns, and this plot is the first plot.
plt.subplot(1, 2, 2)
#the figure has 1 row, 2 columns, and this plot is the second plot.
Shunday qilib, agar biz 2 string va 1 ustunli rasmni xohlasak (ya’ni ikkita chizma yonma-yon emas, balki bir-birining ustiga ko‘rsatiladi), biz sintaksisni quyidagicha yozishimiz mumkin:
Misol
Bir-birining ustiga 2 ta chizma chizing:
import matplotlib.pyplot as plt
import numpy as np
#plot 1:
x = np.array([0, 1, 2, 3])
y = np.array([3, 8, 1, 10])
plt.subplot(2, 1, 1)
plt.plot(x,y)
#plot 2:
x = np.array([0, 1, 2, 3])
y = np.array([10, 20, 30, 40])
plt.subplot(2, 1, 2)
plt.plot(x,y)
plt.show()
Natija:
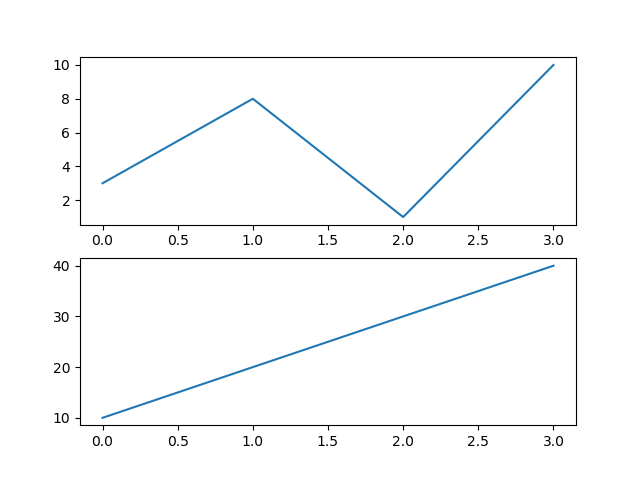
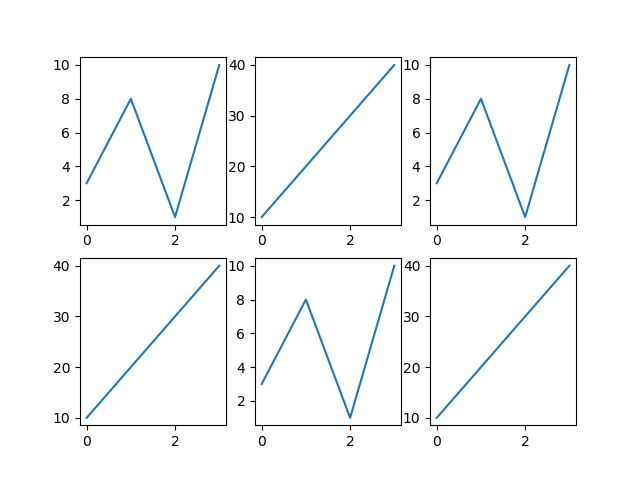
Bitta rasmga o‘zingiz xohlagancha ko‘p chizmalarni chizishingiz mumkin, shunchaki stringlar, ustunlar sonini va uchastka indeksini aniqlang.
Misol
Draw 6 plots:
import matplotlib.pyplot as plt
import numpy as np
x = np.array([0, 1, 2, 3])
y = np.array([3, 8, 1, 10])
plt.subplot(2, 3, 1)
plt.plot(x,y)
x = np.array([0, 1, 2, 3])
y = np.array([10, 20, 30, 40])
plt.subplot(2, 3, 2)
plt.plot(x,y)
x = np.array([0, 1, 2, 3])
y = np.array([3, 8, 1, 10])
plt.subplot(2, 3, 3)
plt.plot(x,y)
x = np.array([0, 1, 2, 3])
y = np.array([10, 20, 30, 40])
plt.subplot(2, 3, 4)
plt.plot(x,y)
x = np.array([0, 1, 2, 3])
y = np.array([3, 8, 1, 10])
plt.subplot(2, 3, 5)
plt.plot(x,y)
x = np.array([0, 1, 2, 3])
y = np.array([10, 20, 30, 40])
plt.subplot(2, 3, 6)
plt.plot(x,y)
plt.show()
Natija:
Sarlavha
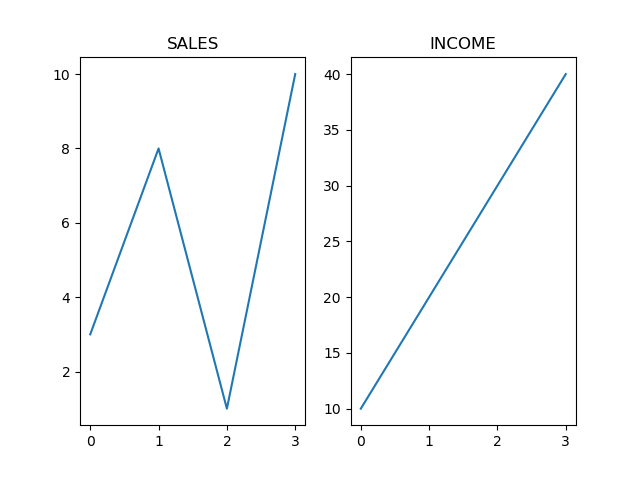
Har bir syujetga title() funksiyasi bilan sarlavha qo‘shishingiz mumkin:
Misol
2 ta uchastka, sarlavhalari bilan:
import matplotlib.pyplot as plt
import numpy as np
#plot 1:
x = np.array([0, 1, 2, 3])
y = np.array([3, 8, 1, 10])
plt.subplot(1, 2, 1)
plt.plot(x,y)
plt.title("SALES")
#plot 2:
x = np.array([0, 1, 2, 3])
y = np.array([10, 20, 30, 40])
plt.subplot(1, 2, 2)
plt.plot(x,y)
plt.title("INCOME")
plt.show()
Natija:
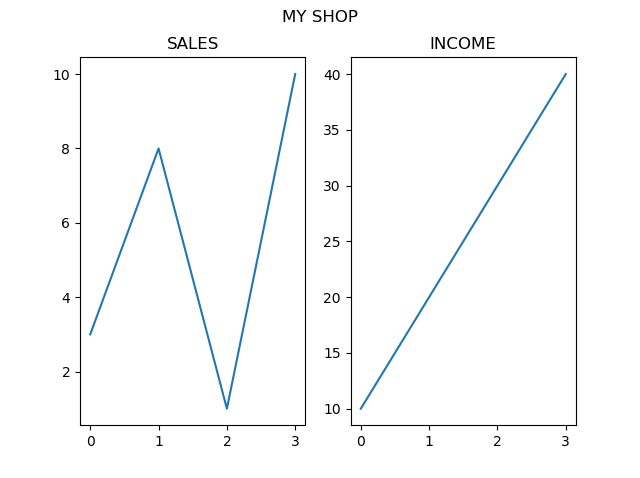
Super Sarlavha
suptitle() funksiyasi yordamida butun rasmga sarlavha qo‘shishingiz mumkin:
Misol
Butun rasmga sarlavha qo‘shing:
import matplotlib.pyplot as plt
import numpy as np
#plot 1:
x = np.array([0, 1, 2, 3])
y = np.array([3, 8, 1, 10])
plt.subplot(1, 2, 1)
plt.plot(x,y)
plt.title("SALES")
#plot 2:
x = np.array([0, 1, 2, 3])
y = np.array([10, 20, 30, 40])
plt.subplot(1, 2, 2)
plt.plot(x,y)
plt.title("INCOME")
plt.suptitle("MY SHOP")
plt.show()
Natija:
W3Schools Pathfinder
Yutuqlaringizni kuzating – bu bepul!